| StockFetcher Forums · Filter Exchange · 5% A WEEK FILTER (BASED ON TRO'S CROCK POT) | << 1 ... 22 23 24 25 26 ... 37 >>Post Follow-up |
| johnpaulca 12,036 posts msg #98353 - Ignore johnpaulca |
1/1/2011 1:25:06 PM johnpaulca msg #91636 - Edit message 4/25/2010 7:27:43 PM MHR : the guys who run this company know their stuff, this is a long term hold. I am holding some below $1. BTW; Moby did you ever buy this stock ??? **************************************************************************************************************************** MHR......hit $8 two days ago |
| tarun766 50 posts msg #108517 - Ignore tarun766 |
10/24/2012 5:18:31 PM Anyone trading this? |
| jackmack 334 posts msg #108637 - Ignore jackmack |
10/31/2012 2:28:09 PM Did this filter need to be manually back tested or was it able to be run through Stratasearch or even here in SF? Anyone? Thank you |
| tarun766 50 posts msg #108641 - Ignore tarun766 |
10/31/2012 10:15:29 PM ^^ wondering the same thing. |
| jackmack 334 posts msg #108814 - Ignore jackmack |
11/15/2012 8:46:37 AM Kevin Good morning I am really interested in this filter but was wondering if you could tweak it to scan for - up 2.5% and with a 5% stop? Just to run it side by side in my saved filters to see how they do and candidates selected. Thank you in advance Cheers |
| jackmack 334 posts msg #108819 - Ignore jackmack |
11/15/2012 9:55:11 AM Would it look like this? /*MEASURE THE DIFFERENCE FROM WEEKLY OPEN TO WEEKLY HIGH*/ set{whiop, weekly high - weekly open} set{Long_Profit, whiop / weekly open } /*DETERMINE THE FREQUENCY THAT 2.5% IS ACHIEVED OVER MULTIPLE TIME FRAMES*/ set{2.5_1wk, count(Long_Profit > .05,1)} set{2.5_4wk, count(Long_Profit > .05,4)} set{2.5_13wk, count(Long_Profit > .05,13)} /*APPLY WEIGHTING FACTORS*/ set{var1,2.5_4wk*0.5} /*WEIGHT 4 WK AVERAGE AT 2X*/ set{var2,2.5_13wk*0.07692} /*WEIGHT 13 WK AVERAGE AT 1X*/ /*CREATE A WEIGHTED SUMMATION OF STOCK PERFORMANCE (MAX SCORE = 3)*/ set{reward,var1+var2} /*DETERMINE THE RISK OF TRIPPING A 5% STOP LOSS*/ set{wloss, weekly open - weekly low} set{max_loss, wloss / weekly open} /*DETERMINE THE FREQUENCY THAT A 10% STOP LOSS IS TRIPPED OVER MULTIPLE TIME FRAMES*/ set{loss_1wk, count(max_loss > .5,1)} set{loss_4wk, count(max_loss > .5,4)} set{loss_13wk, count(max_loss > .5,13)} /*APPLY WEIGHTING FACTORS*/ set{var11,loss_4wk*0.5} /*WEIGHT 4 WK AVERAGE AT 2X*/ set{var21,loss_13wk*0.07692} /*WEIGHT 13 WK AVERAGE AT 1X*/ /*CREATE A WEIGHTED SUMMATION OF RISK (MAX SCORE = 3)*/ set{risk,var11+var21} set{performance,reward/risk} add column performance add column reward {reward} add column risk {risk} add column 2.5_4wk {4 wk reward} add column loss_4wk {4 wk risk} add column 2.5_13wk {13 wk reward} add column loss_13wk {13 wk risk} /*SCREEN FOR THE STRONGEST CANDIDATES*/ weekly open is above 1 average volume(90) above 400000 and reward is greater than 2.8 and draw 5_1wk and draw loss_1wk on plot 5_1wk and do not draw reward sort column 6 descending chart-display is weekly |
| jimmyjazz 102 posts msg #113571 - Ignore jimmyjazz modified |
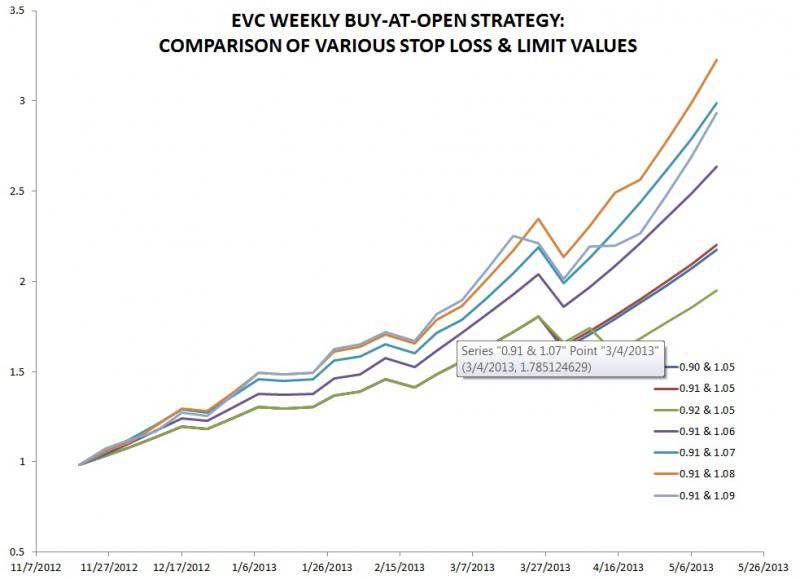
5/21/2013 8:15:56 AM Sorry to resurrect a dormant thread, but I decided to take a look at one specific stock that was caught by this filter and see if I could optimize the stop loss and limit values to maximize compounded weekly returns over the 6-month scan period. The stock is EVC, which was flagged before the open yesterday as having a high reward rating along with low risk, leading to a very high "performance" rating (38). I took the open/close/high/low data and looked at the effects of modifying the 10% stop loss and 5% limit settings. It turns out FOR THIS STOCK that over the past 6 months, one could have done better by using a 9% stop loss along with an 8% sell limit. I assumed that a weekly low below the stop loss triggered the loss, which (I believe) is a more conservative approach than Kevin used in his backtesting. Here is a chart of the various weekly equity curves that came out of this analysis. Thoughts? Is this playing with fire? OK, I need help posting a JPEG file. I tried the [IMG] code but that didn't work. |
| four 5,087 posts msg #113587 - Ignore four modified |
5/21/2013 5:26:18 PM http://www.stockfetcher.com/forums/General-Discussion/How-to-Post-Various-Kewl-Graphic-Stuff-on-SF/53335/0 This site requires no account: http://tinypic.com/ This site requires an email (see below) mktmole 278 posts msg #85968 - Ignore mktmole 1/11/2010 6:34:54 PM SUCCESS ! Here were the steps to post a Chart. Hope this is of benefit to all. 1. Make a Screen Capture of your chart. (Snagit, FastStone Screen Capture, Screen Hunter, Capture WizPro, ScreenPrint, etc) 2. Save your Image to the Desktop 2. Go to http://imageshack.us/ (you can optionally register for free, and this permits you to save your images ) If you do not register, and your image isn't accessed for a year, it is automatically deleted. However, if someone accesses it (even on day 365) the counter is reset, and your image will spend another year on their server. 3. Click Browse and find your saved chart on the Desktop. Select it, and then Open. 4. In Image Shack the chart-link will now appear. 5. Click Upload Now. 6 Followed shortly by "Upload Successful" and a mini image of the chart. 7. Below "Links to Share your Image" look for "HTML Code". Click on this link to highlight and then copy this link. 8. In SF Forums paste the link in your message. When you Preview Message the chart will appear if all is done correctly. |
| jimmyjazz 102 posts msg #113603 - Ignore jimmyjazz |
5/22/2013 6:31:16 PM Yeesh, this is barbaric. Let me try this: |
| jimmyjazz 102 posts msg #113604 - Ignore jimmyjazz modified |
5/22/2013 6:39:26 PM Now, see how a 9% stop loss and an 8% limit order outperformed the other settings for EVC over the last 6 months? If you look at the data, you'll see it causes more holds until close on Friday (where I assumed a sell), but most of those are profitable, anyway, and it turned out to be better to let the winners run all the way to an 8% limit as opposed to cutting them short at 5%. Is this valid theory for a modification of the filter? I don't even know how one would do it, since it requires optimization of every instrument that is flagged. By the way, EVC tripped my 5% limit and closed for a nice profit today. It would not have tripped an 8% limit, and worse, it fell off the cliff after I sold to close at over 12% below my purchase price, so I dodged a bullet there. A 7% limit would have worked, though, so I "left a little on the table". Interesting strategy. |
| StockFetcher Forums · Filter Exchange · 5% A WEEK FILTER (BASED ON TRO'S CROCK POT) | << 1 ... 22 23 24 25 26 ... 37 >>Post Follow-up |